
Although spot market volumes have risen for five straight weeks, we are seeing sort of a “stair-step” progression with weekly growth alternating between increases of 10% or less and jumps of more than 20%. During the week ended May 22 (week 20), total truck spot market load availability in the Truckstop.com system was up 10.1% over the prior week, which had jumped nearly 27% over the week before that.
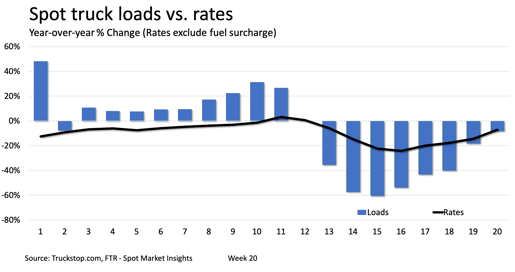
Rates, however, saw their largest increase in the four weeks since they began reversing the big drop in April. The total broker-posted rate per mile excluding fuel surcharges increased 9 cents. Rates were up in all three key segments – dry van, refrigerated, and flatbed. Dry van and flatbed rates were up about 9 cents and 10 cents, respectively – both a high for those segments during the period. Refrigerated rates were up nearly 12 cents, but the increases in weeks 17 and 18 were even stronger.
Refrigerated rates are still about 9 cents below the five-year average for week 20, but they are about 22 cents above the rates in the same 2019 week. Dry van rates remain nearly 25 cents below the five-year average but are roughly the same as last year’s rates for the week. Flatbed rates are about 37 cents below the five-year average about 22 cents below last year. On the plus side, though, flatbed rates are up nearly 20 cents over the past four weeks.
Volumes were about 82% of the five-year average for week 20 and about 92% of the volume in the same week last year. Although loads still have a long way to go to recover fully, the market certainly has made considerable progress. At the bottom six weeks ago, total load volume was just 43% of the five-year average and 39% of 2019.
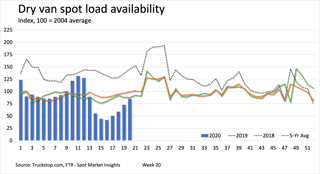
The growth in dry van loads has been more consistent than it has been in other segments since it bottomed out five weeks ago. The week-over-week increase in week 20 was about 17%, which is down from nearly 24% in week 19 but roughly in line with the increases in weeks 17 and 18. Growth week over week was strongest in the Midwest at nearly 36%. West Coast volumes, which had led the prior week, were down nearly 2%. Dry van volumes have recovered to about 86% of the five-year average for week 20 and to about 97% of the same 2019 week.
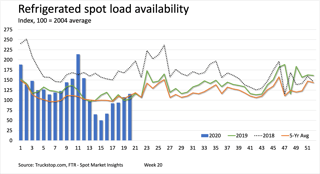
Refrigerated load postings increased nearly 8% in week 20 after rising than 14% in the week before. The segment’s strongest growth during the recovery was in the first two weeks – weeks 16 and 17 – when refrigerated loads jumped 33% and then 38%. As with dry van, the strongest growth in refrigerated volumes was in the Midwest at 32%. The West Coast was down 8%, and the Mountain Central region was down 12%. Refrigerated volumes are roughly in line with the five-year average and about 12% higher than loads in the same week last year.
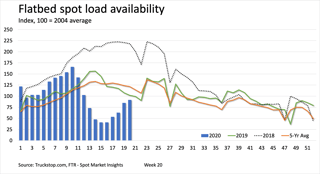
Flatbed volumes were up about 8% after week 19’s 35% increase. The Northeast region – the smallest region for flatbed freight – led growth at nearly 20%, followed by the Southeast at nearly 16% and the midwest at more than 10%. Two other regions saw little growth, and loads were down nearly 2% in the South Central region. Although flatbed volumes have recovered to only about 75% of the five-year average, they are at 90% of last year’s comparable volumes. Also, flatbed has made considerable progress since hitting bottom in week 15. At that point, flatbed loads were just 32% of the five-year average and 28% of last year’s volumes. (For a brief period during March and April 2019, flatbed spot volumes surprisingly were higher than the comparable five-year average.)
Although all segments have recovered reasonably well compared to prior years, those comparisons are about to become far more challenging. June historically is the strongest month for the spot market. Because the economy will be far weaker in June than it normally is, we would not expect volumes to match history. Also, one factor in June’s traditional strength is the Commercial Vehicle Safety Alliance’s International Roadcheck inspection spree, which traditionally occurs early in the month. International Roadcheck has always proven highly disruptive for freight transportation, resulting both in higher spot loads and lower spot capacity. This year, International Roadcheck would have been held in early May, so the spot market would have experienced this artificial boost in early May instead of early June. However, the entire event was cancelled this year because of the COVID-19 pandemic.
For a more granular look at the recovery in total truck and individual segments, see the COVID-19 Truck Freight Recovery Index, which measures trucking’s response and recovery based on pre-pandemic levels, while accounting for historical patterns and seasonal fluctuations. The index, which also is based on Truckstop.com spot load volume data, is available at www.ftrintel.com/coronavirus.