
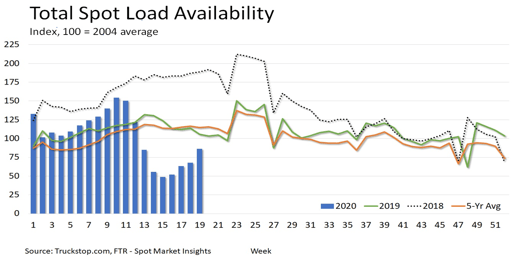
As more states loosen restriction on commerce, total truck spot market volumes jumped nearly 27% – the largest increase since the beginning of the U.S. coronavirus (COVID-19) crisis – during the week ended May 15 (week 19). Load availability has been higher week over week for four weeks, but the only other week with a double-digit increase was week 17. Volumes now are about 75% of the five-year average for week 19 and about 82% of the volume in the same week last year.
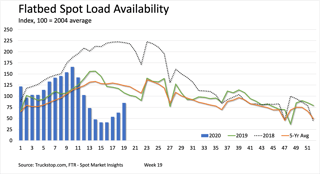
All three key segments saw strong week-over-week growth in load availability. Flatbed posted the strongest growth at nearly 35% above the prior week. Since bottoming out four weeks earlier, weekly flatbed load availability has more than doubled, although it remains more than 30% below the five-year average for week 19 and more than 20% below the same week last year. Growth over week 18 was strongest in the Southeast at 46%, but even the weakest-growth region – the Midwest – was up nearly 23%.
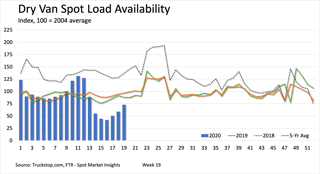
Dry van load availability rose near 24% in week 19. Since bottoming out in week 16, dry van volumes are up 73% and have recovered to about 75% of the average volume for the week over the past five years. Load volumes on the West Coast surged by nearly 54%, and the only region where growth was less than 10% was in the Southeast.
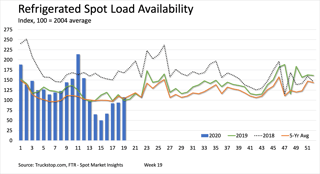
The refrigerated segment’s recovery has been so strong that its week 19 spot volume now slightly exceeds the five-year average for the week. Refrigerated lost postings increased more than 14% in week 19 – not as strong as the other sectors but well above the 1.8% increase recorded in week 18. Since bottoming out four weeks earlier, refrigerated volumes have surged 114% with most of that recovery coming in weeks 16 and 17. The strongest growth was 41% in the Mountain Central Region, followed by South Central and the Midwest. The Southeast, which is the second-largest region in volume, was a drag on refrigerated volumes with an 11% drop in week-over-week volume.
Rates generally were stronger, although they did not match the pace of load volume recovery. The total broker-posted rate per mile excluding fuel surcharges was up about 2 cents after an increase of 11 cents over the prior two weeks. Total rates are about 20% below the five-year average for week 19 and about 15% below a year ago. Dry van rates increased the most of the three segments, rising nearly 5 cents and are about 20% below the five-year average and about 7% below last year. Flatbed rates, which were up 3 cents in week 19, are about 24% below the five-year average for the week and about 20% below the average for the same week last year. Refrigerated rates declined for the week but only by less than a cent. However, refrigerated rates are only 10% below the five-year average for the week and are nearly 3% higher than the same week last year.
In addition to our weekly look at spot metrics, Truckstop.com and FTR have introduced the COVID-19 Truck Freight Recovery Index, which measures trucking’s response and recovery based on pre-pandemic levels, while accounting for historical patterns and seasonal fluctuations. Indices are available for trucking as a whole and for dry van, refrigerated, and flatbed, using Truckstop.com spot load volume data. The COVID-19 Truck Freight Recovery Index is available at www.ftrintel.com/coronavirus.