
Total spot load postings in the Truckstop.com system rose more than 17% during the week ended July 10 (week 27), but volume did not quite rebound to week 25 levels. Weak loads on the Monday following the weekend Independence Day holiday muted week 27 gains. Loads in all key segments – dry van, flatbed, and refrigerated – were higher than in week 26, but rates excluding fuel surcharges were lower in all segments for the first week-over-week decline in total rates since the bottom in week 16.
Load postings in week 27 were dramatically higher in all segments than in 2019 or the five-year average, but comparisons are distorted by the July 4th holiday, which fell squarely in week 27 in recent years but only barely affected week 27 this year. Total load availability was almost 76% higher than the same 2019 week and more than 69% higher than the five-year average. Holiday-related distortions in prior-year comparisons are gone until September, so it will be easier to understand how strong the market is as the economy continues to recover from the economic contraction caused by the coronavirus (COVID-19) pandemic.
Although load volume did not quite match week 25, truck availability – while higher than week 26 – was lower than two weeks ago, so the Market Demand Index – the ratio of loads to trucks in the Truckstop.com system – exceeded week 25.
 Dry van spot volume was up nearly 15% over the previous week. The prior-year comparisons were strongest of all segments with volume 77% above the five-year average and 92% higher than last year. Even though truck availability was slightly higher and load availability lower than in week 25, the dry van MDI remained very strong and is now the second-highest ever, trailing only week 25.
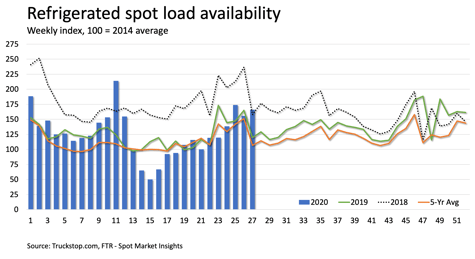 Refrigerated spot loads increased nearly 7% as a 25% drop in Southeast region volume tempered gains elsewhere. Volume was nearly 39% higher than last year and more than 55% above the five-year average. Refrigerated loads did not match week 25, but truck postings were lower, and the refrigerated MDI edged out week 11 as the highest ever.
 Flatbed spot loads rose more than 22%. Volume was nearly 69% above the five-year average and 84% higher than last year. Although load postings did not quite equal week 25, truck availability was lower, and the flatbed MDI now is the highest in two years.
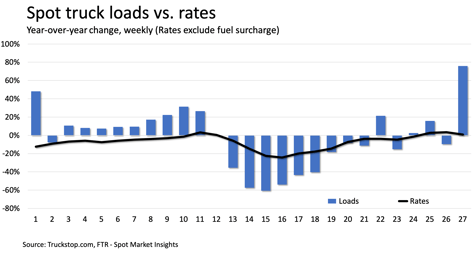 The 10-week streak of rate increases ended in week 27 as the broker-posted rate per mile excluding fuel surcharges declined nearly 4 cents. Rates are still slightly above last year’s level, but they are 4% below the five-year average. Dry van rates, down 5 cents, are just slightly below the five-year average but about 7% higher than last year. Refrigerated rates saw the sharpest decline – about 11 cents per mile – and are 3% below the five-year average but slightly above 2019. Flatbed rates, which were down about a penny, are about 1% below last year and about 5% below the five-year average.