
Spot load postings in the Truckstop.com system increased 0.6% during the week ended October 16 (week 41), but results were mixed as flatbed loads rose while dry van and refrigerated were down slightly week over week. Aside from the record-setting week 39, spot load postings have largely stalled out at high levels, although seasonal expectations would be for softer volumes. The ratio of loads to trucks in the system rose on a decline in truck postings, but it remains below the week 39 record.
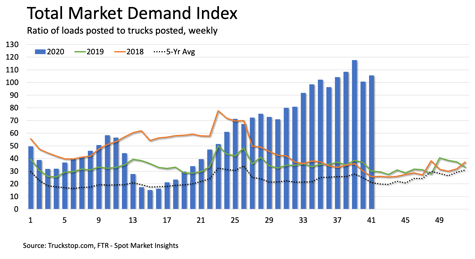
Although the gain in load postings was slight, it comes at a time when seasonal expectations are markedly lower. Therefore, load postings relative to last year and the five-year average were sharply higher in week 41 than they were in week 40. Loads were about double the 2019 level and 114% above the five-year average. Following the prior week’s rare gain in truck postings, trucks were down about 4%, resulting in an increase in the Market Demand Index (MDI) – the ratio of load postings to truck postings in the system – to its third highest level of the year.
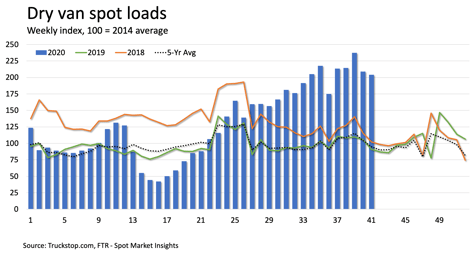 Dry van loads declined 2.3% week over week. Following the 12% drop the prior week, dry van loads were down in two straight weeks for the first time since April. Loads in week 41 were about 124% above the same 2019 week and 115% higher than the five-year average. Truck postings were down 5%, so the dry van MDI rose but remained below the week 39 record.
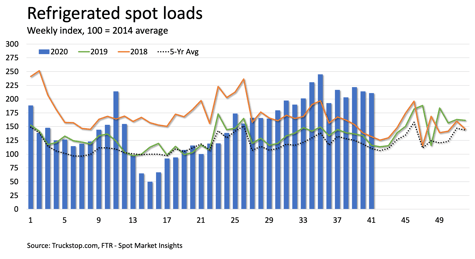 Refrigerated loads decreased 1.4% week over week. Volume had fallen 3.5% in week 40, and the latest decline represented the first back-to-back decreases in about three months. Loads in week 41 were nearly 82% higher than the same week last year and about 91% above the five-year average. Truck postings were down about 3%, so the refrigerated MDI edged slightly higher.
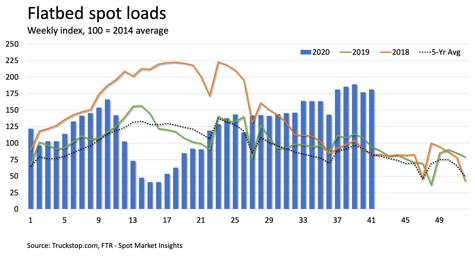 Flatbed spot loads increased 2.3%, which is the largest gain in four weeks and stronger than gains in most weeks since early July. Load postings were 92% higher than the same 2019 week and about 118% above the five-year average. Flatbed truck postings were down about 3%, resulting in an increase in the flatbed MDI.
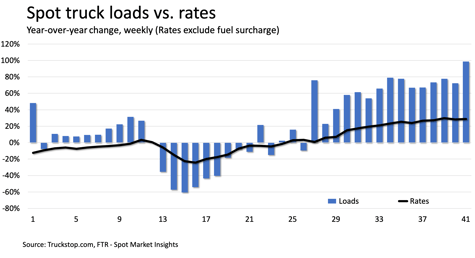 The broker-posted rate per mile excluding fuel surcharges was basically flat week over week. Rates were about 29% above the same week last year and about 23% above the five-year average. Dry van rates also were essentially unchanged and were nearly 49% above last year and about 38% above the five-year average. Refrigerated rates fell about 5 cents but were about 36% higher than last year and about 27% above the five-year average. Flatbed rates were up nearly 1 cent and are 25% higher than the same 2019 week and 20% above the five-year average.