Total spot volume highest since July 2018 as van surge continues
Total spot load postings in the Truckstop.com system rose nearly 11% over the prior week during the week ended June 26 (week 25), edging out week 10 as strongest for spot loads since July 2018. Volume was 20% higher than the five-year average for week 25 even though the week is traditionally one of busiest of the year for the spot market. Growth was especially strong in dry van and refrigerated, both of which had also posted strong gains in week 24. Spot rates also were up sharply in both segments.
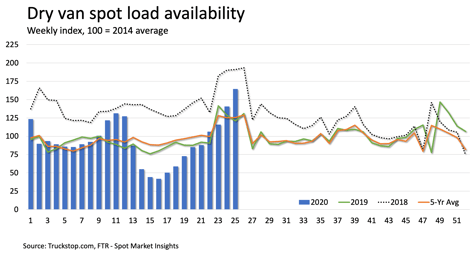
 Dry van spot volume was up nearly 17% over the previous week. Loads were 36% higher than last year and 31% above the five-year average. Dry van spot volume was the highest in just under two years. As was the case the week before, loads were up by double-digit percentages in all regions. With truck availability declining in week 25, the dry van Market Demand Index – the ratio of loads to trucks in the Truckstop.com system – surged to far beyond the extreme 2018 level.
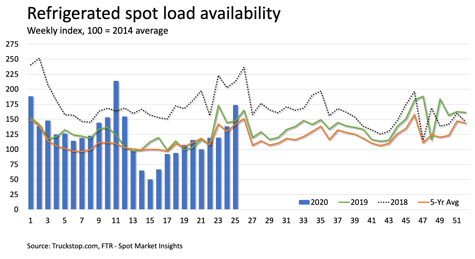
 Refrigerated spot loads jumped more than 25%, which is the largest week-over-week increase in eight weeks. Volume was 18% ahead of the same 2019 week and 22% higher than the five-year average. After a couple of weeks of sharp declines, West Coast volume surged nearly 32%, trailing only the Midwest in week-over-week growth. Refrigerated load availability is the strongest of the year except for the restocking-driving spike in week 11 and the usual post-holiday increase in week 1. With essentially no change in truck availability, the refrigerated MDI surged to a level just barely lower than the record MDI seen in week 11.
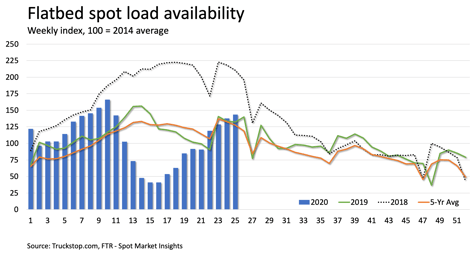
 Flatbed spot loads increased about 4%. Volume was about 9% ahead of last year’s week 25 and about 13% higher than the five-year average. The South Central region saw the strongest week-over-week growth; flatbed volume was down on the West Coast and in the Northeast. Flatbed is still about 13% below volumes in week 10, but that week was the strongest in the segment since June 2018. However, truck availability was down, so the flatbed MDI jumped to above the year’s high in week 10.
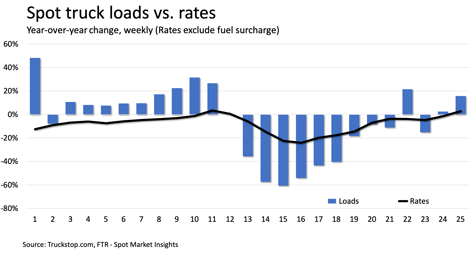
 Although dry van and refrigerated saw larger spot rate increases during the March restocking push, total spot rates saw their strongest week-over-week increase of the year as flatbed rates also were up strongly. The total broker-posted rate per mile excluding fuel surcharges rose almost 10 cents and was nearly 3% above rates in the same 2019 week. However, rates lag the five-year average by about 5%. At bottom in week 16 rates were about 24% below 2019 levels and almost 27% below the five-year average.
Dry van rates rose more than 11 cents a mile and were about 5% above last year but about 6% below the five-year average. Refrigerated rates rose about 15 cents and were nearly 6% above last year but about 5% below the five-year average. Flatbed rates were up 8 cents and were about 1% above the 2019 week but about 6% below the five-year average.

